
Common definitions of Big Data (such as the one in the English edition of Wikipedia, for example) make it clear that we are talking about enormous volumes of data – “data sets with sizes beyond the ability of commonly used software tools to capture, curate, manage and process data within a tolerable elapsed time”. On 25 September 2019, at Bentley Systems digital academy in London, Constructing Excellence held a small conference on big data, and I helped to set the scene.
The big picture
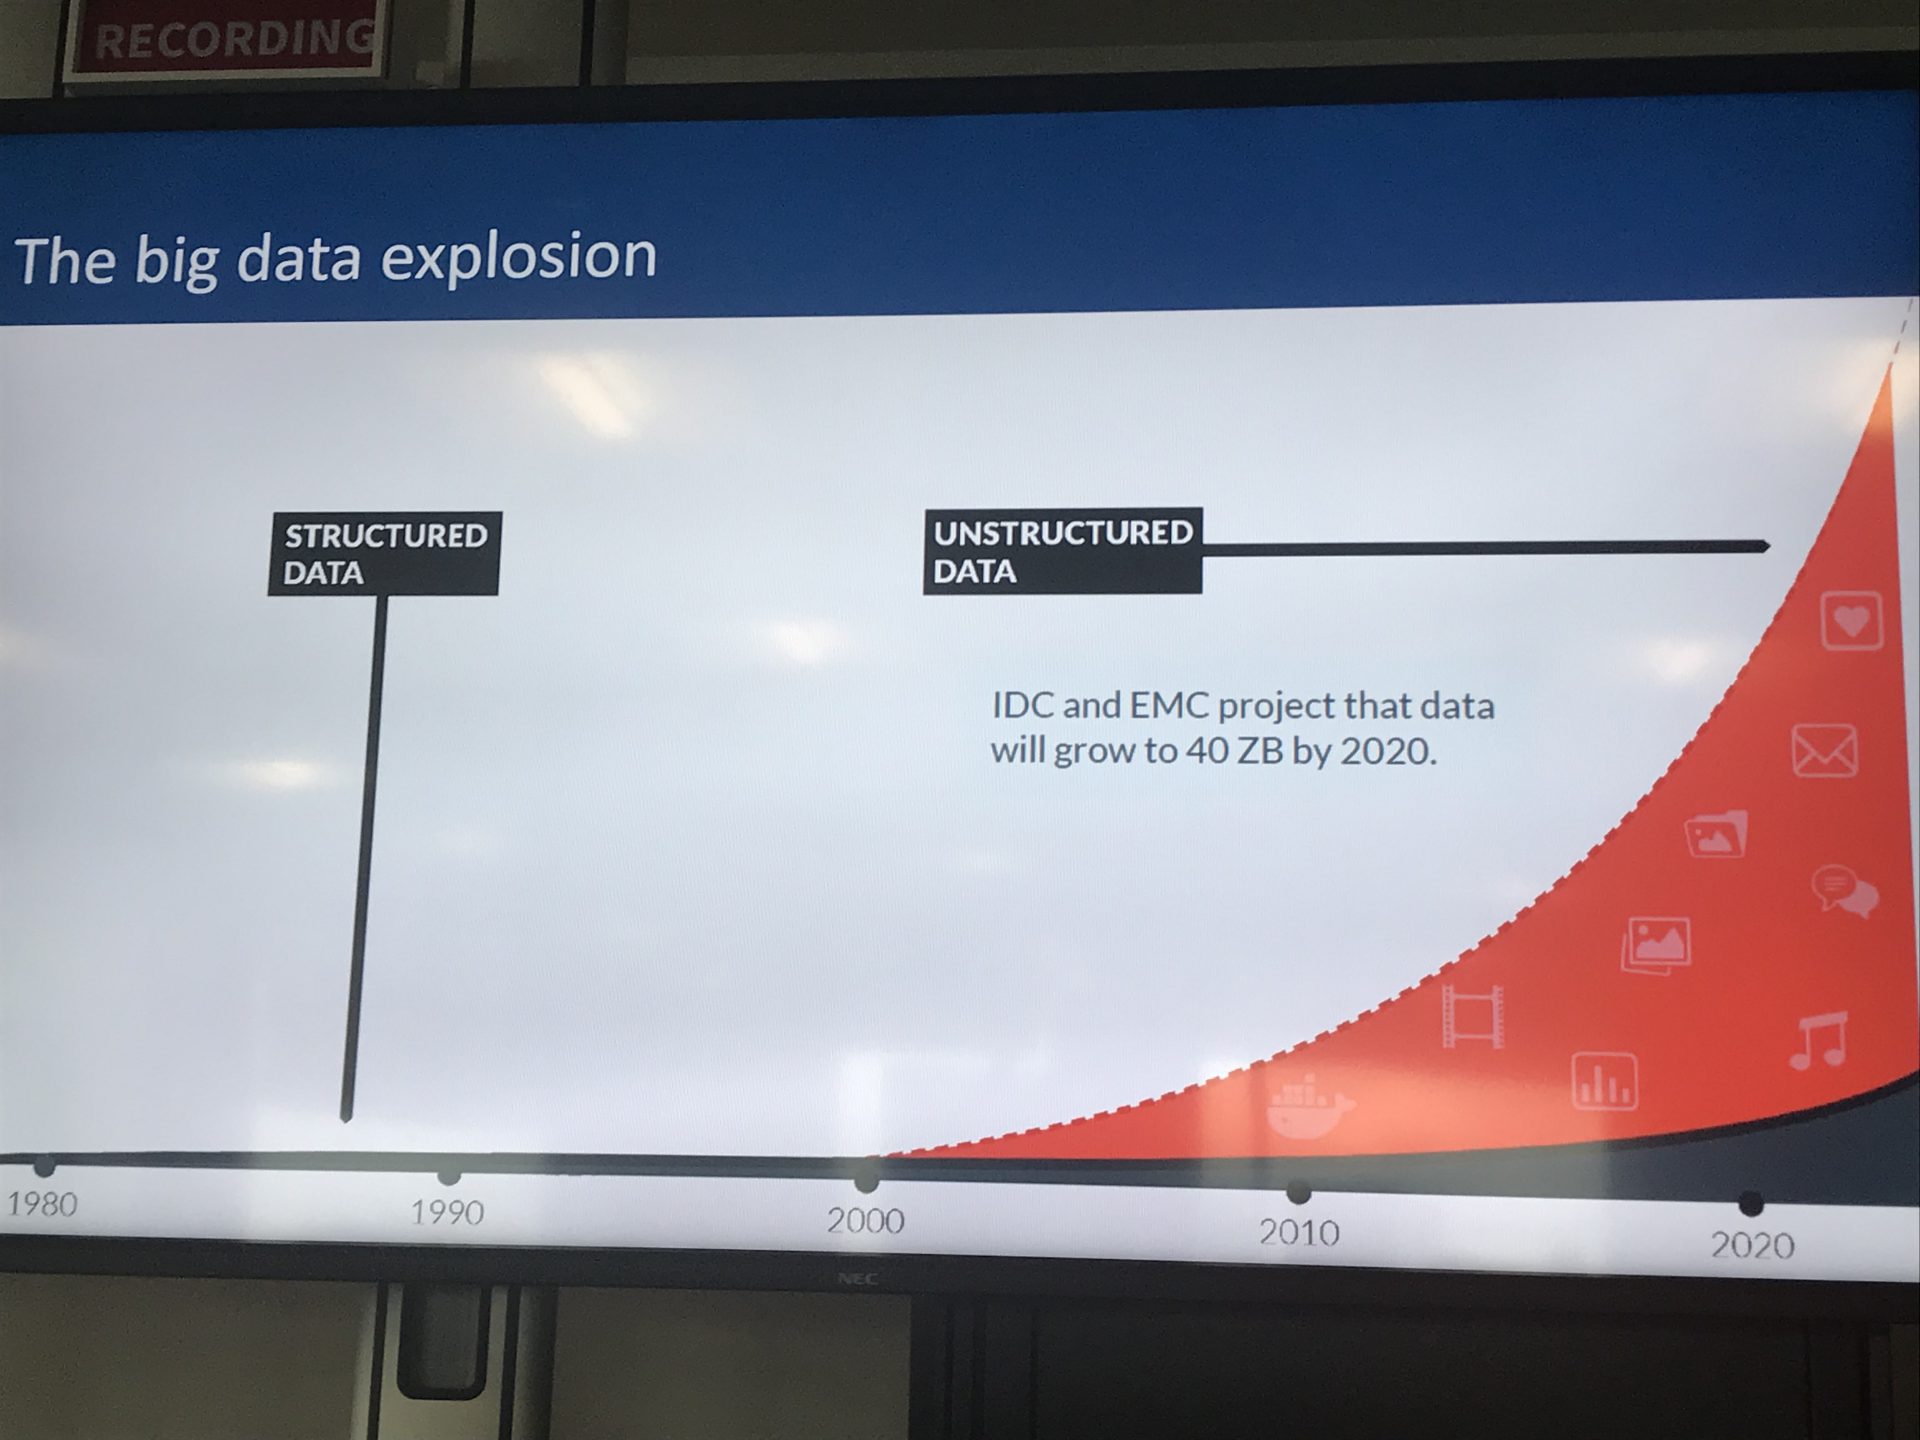
Humanity’s ability to create data is growing almost exponentially. Activities in meteorology, genomics, complex physics, biological and environmental research, internet search, and finance and business informatics (to name just a few) are all spewing out huge volumes of data. In our daily personal and business lives, we are increasingly surrounded by devices that contribute to these volumes (mobile devices, software logs, digital cameras, microphones, RFID readers, wireless sensor networks and streaming instrumentation, among others). Population growth, wider literacy, associated use of mobile devices, and adoption of social media and the ‘Internet of things’ are accelerating the trend.
Ten years ago (2009), we and our hardware and software created just under one zettabyte (that’s a billion billion megabytes) of data – by 2016, this figure had grown to 16.3ZB, and by 2025 it will be ten times as much: 163ZB. And a growing proportion of this data (around 80%) is also unstructured data – data that cannot be neatly defined in rows and columns or in databases – captured in images, video, audio, PDFs, point-clouds, emails, word-processed documents and the like. Such semi-structured and unstructured data requires more storage, is more difficult to manage and protect using legacy solutions, and is more complex to analyse.
BIM, the built environment, BI and Big Data
Core BIM processes, by contrast, tend to involve the creation and sharing of highly structured model data held in interrogable databases – and, at a project level, the data sets are usually well within the capabilities of commonly used tools. Yes, common data environments, CDEs, may also hold a wealth of associated unstructured data, but model authoring applications and the numerous workflows related to creating new built assets (or refurbishing existing ones) tend to be founded on structured data. As a result, we can generate a lot of business intelligence, BI, from all this information, holding it in data warehouses, and presenting it in reports and dashboards, but BI presents a tiny proportion of what might be contained in ‘Big Data‘.
Some AEC technology vendors might like you to think that their platforms will deliver ‘big data’ insights, but usually they are just crunching what is in their databases.
- BI uses descriptive statistics with data with high information density to measure things, detect trends etc.
- In contrast, Big Data analytics uses inductive statistics to infer laws (regressions, nonlinear relationships, and causal effects) from large data sets to reveal relationships or dependencies and to perform predictions. Crucially, Big Data analytics is primarily (often c.90%) focused on un- and semi-structured data.
I used a water analogy to explain the difference. A data warehouse is like a store of bottled water. This water (data) has been filtered, disinfected and packaged for easy consumption – it is clean, refined and structured, and we have confidence in its quality. By contrast, a data lake is like a large body of water in a more natural state: water constantly streams in from different sources to fill the lake, and people can look at the surface, dip a toe in, dive in, or take samples. That data lake holds a vast amount of water (and other things – from microscopic pollutants to plants and animals); its water is not clean, refined or structured, and large volumes of it may need significant processing. Understanding the health and value of the data lake may also involve looking at its situation, and its interdependencies with other systems, and re-appraising it periodically as it will be constantly changing.
Big Data analytics
Analysing big data is typically a multi-step process involving data- and text mining, data optimisation, natural language processing, searching, path/pattern analysis and statistical analysis. Often millions, even billions, of data points need to be processed, so analytics is often conducted on massively parallel software running across multiple servers (technologies include MapReduce, Hadoop and Apache Spark).
Human subject matter experts help identify what data might need to be ingested, how that data might need to be linked, and whether additional processing or data might also be needed. Artificial intelligence and machine learning are also exploited, as algorithms engage in anomaly detection, association rule learning, clustering, classification, regression and summarisation. The outcomes from typical big data analytics can be visualised through various dashboard ‘lenses’: groups / fractal maps, links and networks, geographical maps, and lists.
The information-intensive built environment industry has huge opportunities to exploit the data it collects, and recent UK industry debate about ‘digital twins’ and ‘national digital twins’ hints at what the future might hold. Owner-operators and their project teams often accumulate vast swathes of information, much of it in documents, and sometimes not always well-connected – disciplinary, organisational, contractual, and digital silos often need to be broken down to get the ‘big picture’ about how built projects are planned, designed, constructed and then operated and maintained. Analysing such records across entire portfolios, and even establishing data connections to other portfolios, may yield further insights. Such insights might be even more valuable when decision-makers can also draw on data showing the social, economic and environmental impacts of interactions with the wider built environment, and then start making informed predictions about what new investments might deliver (this is the interconnected vision of the ‘national digital twin’ put forward by the Mark Enzer-led digital framework task group of the Centre for Digital Built Britain).
A case study: BAM Ireland
At the Constructing Excellence mini-conference, Michael Murphy of BAM Ireland illustrated how contractors might exploit the hitherto under-utilised data they collect while delivering their projects. He highlighted how silo mentalities hinder this process, and mentioned a research finding suggesting “95% of all data captured goes unused in the engineering and construction industries.” In its use of data, he said construction needs to shift from being reactive (responding to events that have already happened) to become proactive (actively identifying risks by analysing an organisation’s processes), and then predictive (analysing processes and the environment to identify potential future problems). Murphy also cited a 2019 KPMG survey of 223 business leaders which forecast that data analytics and predictive capability would be the number one priority for tomorrow’s construction businesses.
“What if every team member, across every discipline, could predict and act to prevent risk, every day?” Murphy suggested. BAM worked with Autodesk to develop and apply its Construction IQ technology, which analysed data collected by its BIM 360 suite during delivery of projects. Like many other construction organisations, BAM was often engaged on multiple projects simultaneously, and so looked to digitise its information capture processes rather than rely on traditional paper-based data management methods (time-consuming to compile, with data rarely used to its full potential).
While using the BIM 360 suite on a seven-project BIM to FM programme to deliver court buildings for Ireland’s Ministry of Justice, BAM began to exploit the thousands of pieces of data its teams were collecting. The initial project and programme dashboards were alarming, though: Murphy said 100s of high risk issues appeared to be outstanding on each project, suggesting BAM Ireland was a high risk contractor. However, further investigation revealed that many issues had been dealt with, but (highlighting a training issue) the BIM 360 users involved had not closed the issue in the platform.
Once users got used to reporting and tracking issues through to closure, they were able to provide a more accurate view of their ongoing project risks, and those of subcontractors engaged on the projects. The analysis and reporting tools then became more useful in answering questions such as: What safety risks are trending on my project? Which projects are carrying more risk? What disciplines drive RFIs in my project? What are the root causes of RFIs in my projects?
Murphy said BAM Ireland achieved a 20% improvement in quality and safety on site with the added capacity to make better decisions supported by the solutions. Managers now have an easily accessible, cross-project dashboard that improves oversight across multiple complex projects. Data capture techniques improved – workflows were 95% digital – reducing paper usage to only mandatory, legal documents. And project staff now spends 25% more time focusing on tasks and risk items through the use of Construction IQ. Murphy finished his presentation with a quote from BAM Ireland’s head of digital construction, Paul Brennan:
“While other construction software solutions are simply focused on digitizing paper based workflows, BIM 360 is taking it a step further to truly harness the power of data. This is where our team sees the most value and where we can really start to have a positive impact on improving the challenges our industry is faced with.”
Comments are closed.